Quick-start to run a morphologica example
This page is going to show you how to build and run one of the morphologica 2D graph examples.
Quick-start assumption: You’re using a Debian flavour of Linux. If you’re using another type of Linux, then I hope you can figure out the packages you’ll need from the list below and how to install them. In all other ways, the process will be the same. If you’re using a Mac, see README.build.mac for help getting dependencies in place. It’s README.build.windows for Windows users (vcpkg is used to obtain dependencies).
Install dependencies
This command will install dependencies for building graph1.cpp and (almost) all the other examples (assuming a Debian-like OS)
sudo apt install build-essential cmake git wget  \
                 nlohmann-json3-dev librapidxml-dev \
                 freeglut3-dev libglu1-mesa-dev libxmu-dev libxi-dev \
                 libglfw3-dev libfreetype-dev libarmadillo-dev libhdf5-dev
Clone the code
Get your copy of the morphologica code from Github.
git clone git@github.com:ABRG-Models/morphologica
Prepare the build
cd morphologica
mkdir build         # Create a build directory
cd build
Do the build
You first run cmake to generate makefiles, then make will execute the compiler calls.
cmake ..            # Call cmake to generate the makefiles
make graph1         # Compile a single one of the examples. Add VERBOSE=1 to see the compiler commands.
(There are lots of other examples—Try make graph2 or make convolve.)
Run the program
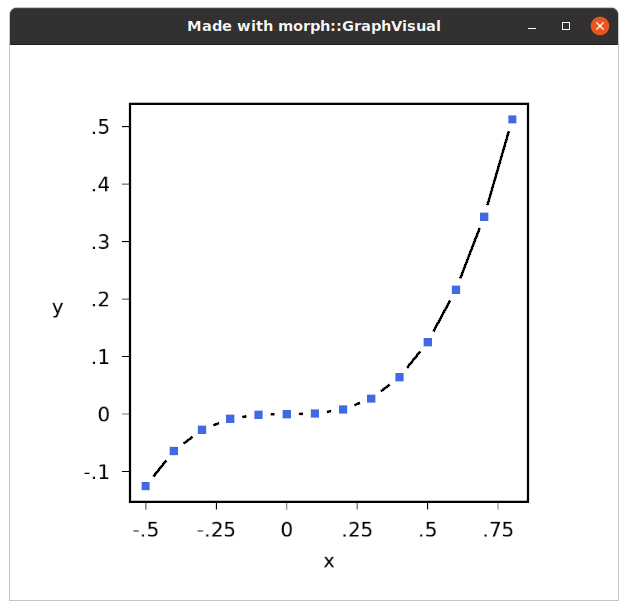
./examples/graph1   # Run the program. You should see a graph of a cubic function.
# After closing the graph1 program, open its source code and modify something (see examples/graph2.cpp for ideas)
gedit ../examples/graph1.cpp
The program graph1.cpp is:
// Visualize a graph. Minimal example showing how a default graph appears
#include <morph/Visual.h>
#include <morph/GraphVisual.h>
#include <morph/vvec.h>

int main()
{
    // Set up a morph::Visual 'scene environment'.
    morph::Visual v(1024, 768, "Made with morph::GraphVisual");
    // Create a GraphVisual object (obtaining a unique_ptr to the object) with a spatial offset within the scene of 0,0,0
    auto gv = std::make_unique<morph::GraphVisual<double>> (morph::vec<float>({0,0,0}));
    // This mandatory line of boilerplate code sets the parent pointer in GraphVisual and binds some functions
    v.bindmodel (gv);
    // Data for the x axis. A vvec is like std::vector, but with built-in maths methods
    morph::vvec<double> x;
    // This works like numpy's linspace() (the 3 args are "start", "end" and "num"):
    x.linspace (-0.5, 0.8, 14);
    // Set a graph up of y = x^3
    gv->setdata (x, x.pow(3));
    // finalize() makes the GraphVisual compute the vertices of the OpenGL model
    gv->finalize();
    // Add the GraphVisual OpenGL model to the Visual scene, transferring ownership of the unique_ptr
    v.addVisualModel (gv);
    // Render the scene on the screen until user quits with 'Ctrl-q'
    v.keepOpen();
    // Because v owns the unique_ptr to the GraphVisual, its memory will be deallocated when v goes out of scope.
    return 0;
}
The program generates a clean looking graph…
…and the code compares favourably (in terms of amount of boilerplate code) with the equivalent Python, graph1.py:
# Visualize the graph from graph1.cpp in Python
import matplotlib.pyplot as plt
import numpy as np

# Create some data for the x axis
x = np.linspace(-0.5, 0.8, 14)
# Set a graph up of y = x^3
plt.plot(x, np.power(x,3), '-o')
# Add labels
plt.title('Made with Python/numpy/matplotlib')
plt.xlabel('x')
plt.ylabel('y')
# Render the graph on the screen until user quits with 'q'
plt.show()